What was the occupancy factor for segment D - E?
Solution
D–E has seats reserved: .
Answer: (B) 70%
Data tables with missing values to fill in from the conditions.
Appeared in 9 of 18 slots. Most recent: CAT 2025 Slot 1.
| Year | Slot 1 | Slot 2 | Slot 3 | Sets |
|---|---|---|---|---|
| CAT 2025 | 1 | 0 | 2 | 3 |
| CAT 2024 | 0 | 0 | 2 | 2 |
| CAT 2023 | 1 | 0 | 2 | 3 |
| CAT 2022 | 0 | 0 | 1 | 1 |
| CAT 2021 | 0 | 0 | 0 | 0 |
| CAT 2020 | 1 | 2 | 1 | 4 |
| Total | 3 | 2 | 8 | 13 |
A train travels from Station A to Station E, passing through stations B, C, and D, in that order. The train has a seating capacity of 200. A ticket may be booked from any station to any other station ahead on the route, but not to any earlier station.
A ticket from one station to another reserves one seat on every intermediate segment of the route. For example, a ticket from B to E reserves a seat in the intermediate segments B - C, C - D, and D - E.
The occupancy factor for a segment is the total number of seats reserved in the segment as a percentage of the seating capacity. The total number of seats reserved for any segment cannot exceed 200.
The following information is known.
1. Segment C - D had an occupancy factor of 95%. Only segment B - C had a higher occupancy factor.
2. Exactly 40 tickets were booked from B to C and 30 tickets were booked from B to E.
3. Among the seats reserved on segment D - E, exactly four-sevenths were from stations before C.
4. The number of tickets booked from A to C was equal to that booked from A to E, and it was higher than that from B to E.
5. No tickets were booked from A to B, from B to D and from D to E.
6. The number of tickets booked for any segment was a multiple of 10.
Tickets that can be non-zero: A→C, A→D, A→E, B→C (40), B→E (30), C→D, C→E. (A→B, B→D, D→E are zero.)
Segment loads: A–B ; B–C ; C–D ; D–E .
Statement 3: , so and D–E .
is a multiple of 10 above 30 and must be divisible by 4: gives D–E ; gives 210 (too many). So , .
C–D: . B–C must exceed 190 and be at most 200, so and .
Loads: A–B 130, B–C 200, C–D 190, D–E 140.
What was the occupancy factor for segment D - E?
D–E has seats reserved: .
How many tickets were booked from Station A to Station E?
A→E .
How many tickets were booked from Station C?
From C: C→D C→E .
What is the difference between the number of tickets booked to Station C and the number of tickets booked to Station D?
To C: . To D: . Difference .
How many tickets were booked to travel in exactly one segment?
One-segment tickets: B→C (40) and C→D (20); A→B and D→E are zero. Total .
Three countries — Pumpland (P), Xiland (X) and Cheeseland (C) — trade among themselves and with the (other countries in) Rest of World (ROW). All trade volumes are given in IC (international currency). The following terminology is used:
• Trade balance = Exports - Imports
• Total trade = Exports + Imports
• Normalized trade balance = Trade balance / Total trade, expressed in percentage terms
The following information is known.
1. The normalized trade balances of P, X and C are 0%, 10%, and -20%, respectively.
2. 40% of exports of X are to P. 22% of imports of P are from X.
3. 90% of exports of C are to P; 4% are to ROW.
4. 12% of exports of ROW are to X, 40% are to P.
5. The export volumes of P, in IC, to X and C are 600 and 1200, respectively. P is the only country that exports to C.
C imports only from P: 1200. Normalised balance : .
C's exports: P 720, ROW 32, X 48.
Let , be the total exports of X and ROW. X's imports , and its balance gives .
P's imports , and X supplies 22% of them: P's imports.
Solving: , , P's imports P's exports.
P → ROW . ROW → ROW of 2100 .
How much is exported from C to X, in IC?
C → X of 800 .
How much is exported from P to ROW, in IC?
P's exports , so P → ROW .
How much is exported from ROW to ROW, in IC?
ROW sends of 2100 to itself: .
What is the trade balance of ROW?
ROW exports to P and X: . Imports from P, X, C: . Balance .
Which among the countries P, X, and C has/have the least total trade?
Total trade: P , X , C . Both X and C are lowest.
Anu, Bijay, Chetan, Deepak, Eshan, and Faruq are six friends. Each of them uses a mobile number from exactly one of the two mobile operators - Xitel and Yocel. During the last month, the six friends made several calls to each other. Each call was made by one of these six friends to another. The table below summarizes the number of minutes of calls that each of the six made to (outgoing minutes) and received from (incoming minutes) these friends, grouped by the operators. Some of the entries are missing.
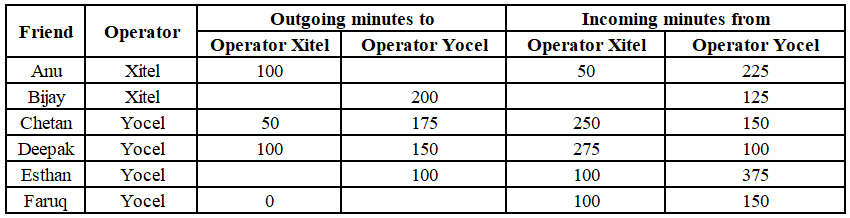
It is known that the duration of calls from Faruq to Eshan was 200 minutes. Also, there were no calls from:
i. Bijay to Eshan,
ii. Chetan to Anu and Chetan to Deepak,
iii. Deepak to Bijay and Deepak to Faruq,
iv. Eshan to Chetan and Eshan to Deepak.
Xitel: Anu, Bijay. Yocel: Chetan, Deepak, Eshan, Faruq.
Anu's 100 outgoing Xitel minutes all go to Bijay, and Anu's 50 incoming Xitel minutes come from Bijay.
Chetan → Bijay (Chetan → Anu is 0). Deepak → Anu (Deepak → Bijay is 0).
Eshan's Yocel calls can only go to Faruq: Eshan → Faruq .
Faruq receives 150 from Yocel: Chetan → Faruq , so Chetan → Eshan .
Eshan receives 375 from Yocel: Deepak → Eshan , so Deepak → Chetan .
Deepak receives 100 from Yocel, all from Faruq. Chetan receives 150 from Yocel: Faruq → Chetan .
What was the duration of calls (in minutes) from Bijay to Anu?
Bijay → Anu (Anu's incoming Xitel minutes).
What was the total duration of calls (in minutes) made by Anu to friends having mobile numbers from Operator Yocel?
Xitel → Yocel minutes total . Bijay sends 200, so Anu sends .
What was the total duration of calls (in minutes) made by Faruq to friends having mobile numbers from Operator Yocel?
Faruq → Chetan 50 Deepak 100 Eshan 200 .
What was the duration of calls (in minutes) from Deepak to Chetan?
Deepak → Chetan .
The table given below shows the amount, in grams, of carbohydrate, protein, fat and all other nutrients, per 100 grams of nutrients in seven food grains. The first column shows the food grain category and the second column its codename. The table has some missing values.
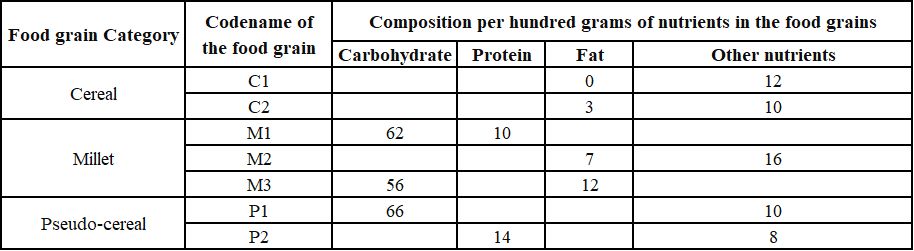
The following additional facts are known.
1. Both the pseudo-cereals had higher amounts of carbohydrate as well as higher amounts of protein than any millet.
2. Both the cereals had higher amounts of carbohydrate than any pseudo-cereal.
3. All the missing values of carbohydrate amounts (in grams) for all the food grains are non-zero multiples of 5.
4. All the missing values of protein, fat and other nutrients amounts (in grams) for all the food grains are non-zero multiples of 4.
5. P1 contained double the amount of protein that M3 contains.
Each row sums to 100. Missing carbohydrate values are multiples of 5; other missing values are multiples of 4.
C1: carb + protein , so carb is a multiple of 20 and above 66: 80, protein 8. C2: carb + protein : carb 75, protein 12.
P2: carb + fat , with carb between the millets and the cereals: 70, fat 8.
M3: protein + other . P1 protein M3 protein, above every millet's protein, with P1 fat protein non-zero: M3 protein 8 (other 24), P1 protein 16 (fat 8).
M2: carb + protein , carb below 66, protein below 14: carb 65, protein 12.
| Grain | Carb | Protein | Fat | Other |
|---|---|---|---|---|
| C1 | 80 | 8 | 0 | 12 |
| C2 | 75 | 12 | 3 | 10 |
| M1 | 62 | 10 | – | – |
| M2 | 65 | 12 | 7 | 16 |
| M3 | 56 | 8 | 12 | 24 |
| P1 | 66 | 16 | 8 | 10 |
| P2 | 70 | 14 | 8 | 8 |
How many foodgrains had a higher amount of carbohydrate per 100 grams ofnutrients than M1?
Above 62: C1, C2, M2, P1, P2, i.e. .
How many grams of protein were there in 100 grams of nutrients in M2?
M2 protein .
How many grams of other nutrients were there in 100 grams of nutrients in M3?
M3 other nutrients .
What is the median of the number of grams of protein in 100 grams of nutrients among these food grains?
Proteins: 8, 8, 10, 12, 12, 14, 16. Median .
Out of 10 countries -- Country 1 through Country 10 -- Country 9 has the highest gross domestic product (GDP), and Country 10 has the highest GDP per capita. GDP per capita is the GDP of a country divided by its population. The table below provides the following data about Country 1 through Country 8 for the year 2024.
• Column 1 gives the country's identity.
• Column 2 gives the country’s GDP as a fraction of the GDP of Country 9.
• Column 3 gives the country’s GDP per capita as a fraction of the GDP per capita of Country10.
• Column 4 gives the country’s annual GDP growth rate.
• Column 5 gives the country’s annual population growth rate.
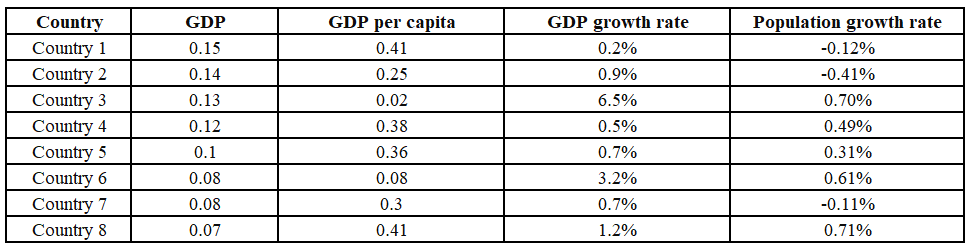
Assume that the GDP growth rates and population growth rates of the countries will remain constant for the next three years.
Population (in the table's units):
Country 1: 0.366, 2: 0.56, 3: 6.5, 4: 0.316, 5: 0.278, 6: 1.0, 7: 0.267, 8: 0.171.
Future values: multiply by .
Which one among the countries 1 through 8, has the smallest population in 2024?
Smallest population ratio: Country 8 ().
The ratio of Country 4’s GDP to Country 5’s GDP in 2026 will be closest to
.
Which one among the countries 1, 4, 5, and 7 will have the largest population in 2027?
2027 populations: 1: ; 4: ; 5: ; 7: . Largest: Country 1.
For how many countries among Country 1 through Country 8 will the GDP per capita in 2027 be lower than that in 2024?
Per capita falls only if population grows faster than GDP. Every country's GDP growth beats its population growth (closest: Country 4, 0.5% vs 0.49%). Answer: .
Five restaurants, coded R1, R2, R3, R4 and R5 gave integer ratings to five gig workers -
Ullas, Vasu, Waman, Xavier and Yusuf, on a scale of 1 to 5.
The means of the ratings given by R1, R2, R3, R4 and R5 were 3.4, 2.2, 3.8, 2.8 and 3.4 respectively.
The summary statistics of these ratings for the five workers is given below.
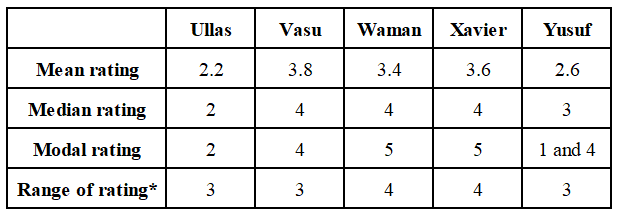
* Range of ratings is defined as the difference between the maximum and minimum ratings awarded to a worker.
The following is partial information about ratings of 1 and 5 awarded by the restaurants to the workers.
(a) R1 awarded a rating of 5 to Waman, as did R2 to Xavier, R3 to Waman and Xavier, and R5 to Vasu.
(b) R1 awarded a rating of 1 to Ullas, as did R2 to Waman and Yusuf, and R3 to Yusuf.
Worker rating sets from mean, median, mode and range:
Ullas , Vasu , Waman , Xavier , Yusuf .
Restaurant totals: R1 17, R2 11, R3 19, R4 14, R5 17.
R2 needs Ullas + Vasu : 2 and 2. R3 needs Ullas + Vasu : 4 and 4.
The rest follows from the totals:
| Ullas | Vasu | Waman | Xavier | Yusuf | |
|---|---|---|---|---|---|
| R1 | 1 | 4 | 5 | 3 | 4 |
| R2 | 2 | 2 | 1 | 5 | 1 |
| R3 | 4 | 4 | 5 | 5 | 1 |
| R4 | 2 | 4 | 4 | 1 | 3 |
| R5 | 2 | 5 | 2 | 4 | 4 |
How many individual ratings cannot be determined from the above information?
Every rating is fixed: .
To how many workers did R2 give a rating of 4?
R2 gave 2, 2, 1, 5, 1: no 4s, so .
What rating did R1 give to Xavier?
R1 gave Xavier .
What is the median of the ratings given by R3 to the five workers?
R3: 1, 4, 4, 5, 5. Median .
Which among the following restaurants gave its median rating to exactly one of the workers?
R4: 1, 2, 3, 4, 4; median 3, given only to Yusuf.
An air conditioner (AC) company has four dealers - D1, D2, D3 and D4 in a city. It is evaluating sales performances of these dealers. The company sells two variants of ACs - Window and Split. Both these variants can be either Inverter type or Non-inverter type. It is known that of the total number of ACs sold in the city, 25% were of Window variant, while the rest were of Split variant. Among the Inverter ACs sold, 20% were of Window variant.
The following information is also known:
1. Every dealer sold at least two window ACs.
2. D1 sold 13 inverter ACs, while D3 sold 5 Non-inverter ACs.
3. A total of six Window Non-inverter ACs and 36 Split Inverter ACs were sold in the city.
4. The number of Split ACs sold by D1 was twice the number of Window ACs sold by it.
5. D3 and D4 sold an equal number of Window ACs and this number was one-third of the number of similar ACs sold by D2.
6. D2 and D3 were the only ones who sold Window Non-inverter ACs. The number of these ACs sold by D2 was twice the number of these ACs sold by D3.
7. D3 and D4 sold an equal number of Split Inverter ACs. This number was half the number of similar ACs sold by D2.
Split Inverter of Inverter, so Inverter and Window Inverter . Window of all, so total , Split , Split Non-inverter .
Window per dealer: D3 D4 , D2 , each at least 2, total 15: , so D1 5, D2 6, D3 2, D4 2. D1 sells Split.
Window Non-inverter: D2 4, D3 2. So Window Inverter: D1 5, D2 2, D3 0, D4 2.
D1 Inverter 13 means Split Inverter 8. The rest, , gives : D3 7, D4 7, D2 14.
D3 Non-inverter 5: Window 2 + Split 3. Split Non-inverter: D1 2, D3 3, and D2 + D4 .
Totals: D1 15, D2 , D3 12, D4 (x = D2's Split Non-inverter).
How many Split Inverter ACs did D2 sell?
D2 sold Split Inverter ACs.
What percentage of ACs sold were of Non-inverter type?
Non-inverter of 60 .
What was the total number of ACs sold by D2 and D4?
D2 + D4 .
Which of the following statements is necessarily false?
D1 + D3 and D2 + D4 , so D is necessarily false.
If D3 and D4 sold an equal number of ACs, then what was the number of Non-inverter ACs sold by D2?
D4 D3 . D2's Non-inverter .
In a coaching class, some students register online, and some others register offline. No student registers both online and offline; hence the total registration number is the sum of online and offline registrations. The following facts and table pertain to these registration numbers for the five months - January to May of 2023. The table shows the minimum, maximum, median registration numbers of these five months, separately for online, offline and total number of registrations. The following additional facts are known.
1. In every month, both online and offline registration numbers were multiples of 10.
2. In January, the number of offline registrations was twice that of online registrations.
3. In April, the number of online registrations was twice that of offline registrations.
4. The number of online registrations in March was the same as the number of offline registrations in February.
5. The number of online registrations was the largest in May.
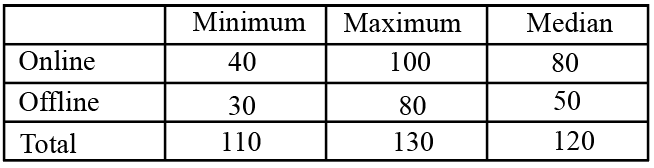
January: offline online with total 110–130, so 40 + 80 = 120. April: online offline: 80 + 40 = 120.
May has the largest online (100), and its total can't exceed 130, so May is 100 + 30 = 130.
February and March must supply an offline 50 (median), a total of 110 (minimum), and an online pair around 80, with March online February offline.
Only one choice works: February 80 + 50 = 130, March 50 + 60 = 110.
| Month | Online | Offline | Total |
|---|---|---|---|
| Jan | 40 | 80 | 120 |
| Feb | 80 | 50 | 130 |
| Mar | 50 | 60 | 110 |
| Apr | 80 | 40 | 120 |
| May | 100 | 30 | 130 |
What was the total number of registrations in April?
April total .
What was the number of online registrations in January?
January online .
Which of the following statements can be true?
I. The number of offline registrations was the smallest in May.
II. The total number of registrations was the smallest in February.
May's offline (30) is the smallest, so I is true. February's total (130) is not the smallest, so II is false. Only I.
What best can be concluded about the number of offline registrations in February?
February offline .
Which pair of months definitely had the same total number of registrations?
I. January and April
II. February and May
January and April are both 120; February and May are both 130. Both I and II.
There are only four neighbourhoods in a city - Levmisto, Tyhrmisto, Pesmisto and Kitmisto.During the onset of a pandemic, the number of new cases of a disease in each of these neighbourhoods was recorded over a period of five days. On each day, the number of newcases recorded in any of the neighbourhoods was either 0, 1, 2 or 3.
The following facts are also known:
1.There was at least one new case in every neighbourhood on Day 1.
2.On each of the five days, there were more new cases in Kitmisto than in Pesmisto.
3.The number of new cases in the city in a day kept increasing during the five-day period. The number of new cases on Day 3 was exactly one more than that on Day 2.
4.The maximum number of new cases in a day in Pesmisto was 2, and this happened only once during the five-day period.
5.Kitmisto is the only place to have 3 new cases on Day 2.
6.The total numbers of new cases in Levmisto, Tyhrmisto, Pesmisto and Kitmisto over the five-day period were 12, 12, 5 and 14 respectively.
Kitmisto: 14 cases with at most 3 a day, so four 3s and one 2. Pesmisto: 5 cases with exactly one 2 and the rest at most 1, so one 2, three 1s and one 0.
Pesmisto is at most 2, so a day's total is at most . Day 2 is at most .
City total . With totals increasing and Day 3 Day 2 :
Day 2 would need Day 5 (impossible); Day 2 leaves too little for Day 1. So the totals are 5, 8, 9, 10, 11.
Day 5 : L, T, K and P . Day 1 with everyone at least 1 and K P: K 2, others 1.
Days 2–4: K is 3 each day. Day 2: L, T are at most 2, so P , L T . Day 4: L T forces P , L T . Day 3: P , L T .
| Day | 1 | 2 | 3 | 4 | 5 |
|---|---|---|---|---|---|
| Levmisto | 1 | 2 | 3 | 3 | 3 |
| Tyhrmisto | 1 | 2 | 3 | 3 | 3 |
| Pesmisto | 1 | 1 | 0 | 1 | 2 |
| Kitmisto | 2 | 3 | 3 | 3 | 3 |
| Total | 5 | 8 | 9 | 10 | 11 |
What BEST can be concluded about the total number of new cases in the city on Day2?
Day 2 total .
What BEST can be concluded about the number of new cases in Levmisto on Day 3?
Levmisto had on Day 3.
On which day(s) did Pesmisto not have any new case?
Pesmisto had no case only on Day 3.
Which of the two statements below is/are necessarily false?
Statement A: There were 2 new cases in Tyhrmisto on Day 3.
Statement B: There were no new cases in Pesmisto on Day 2.
Tyhrmisto had 3 on Day 3 and Pesmisto had 1 on Day 2. Both statements are false.
On how many days did Levmisto and Tyhrmisto have the same number of new cases?
Levmisto and Tyhrmisto match on all days.
In a certain board examination, students were to appear for examination in five subjects:
English, Hindi, Mathematics, Science and Social Science. Due to a certain emergency situation, a few of the examinations could not be conducted for some students. Hence, some students missed one examination and some others missed two examinations. Nobody missed more than two examinations.
The board adopted the following policy for awarding marks to students. If a student appeared in all five examinations, then the marks awarded in each of the examinations were on the basis of the scores obtained by them in those examinations.
If a student missed only one examination, then the marks awarded in that examination was the average of the best three among the four scores in the examinations they appeared for. If a student missed two examinations, then the marks awarded in each of these examinations was the average of the best two among the three scores in the examinations they appeared for. The marks obtained by six students in the examination are given in the table below. Each of them missed either one or two examinations.
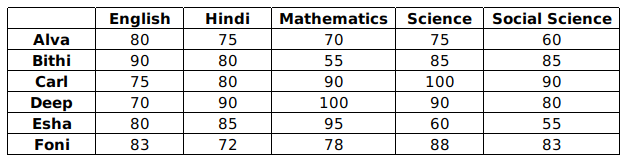
The following facts are also known.
I. Four of these students appeared in each of the English, Hindi, Science, and Social Science examinations.
II. The student who missed the Mathematics examination did not miss any other examination.
III. One of the students who missed the Hindi examination did not miss any other examination. The other student who missed the Hindi examination also missed the Science examination.
A missed paper's mark equals the average of the best three of four scores (one missed) or of the best two of three (two missed). Testing each student:
| Student | Possible missed papers |
|---|---|
| Alva | Hindi; Science; or both (75 avg of 80, 70, 75 or 80, 70) |
| Bithi | Science; Social Sc.; or both (85) |
| Carl | Maths; Social Sc.; or both (90) |
| Deep | Hindi; Science; or both (90) |
| Esha | English only (80) |
| Foni | English; Social Sc.; or both (83) |
Fact I: exactly two students missed each of English, Hindi, Science and Social Science.
English: Esha and one more, which can only be Foni. Fact II: the Maths absentee missed nothing else, so Carl missed only Maths and Social Science's two absentees are Bithi and Foni.
Fact III: Hindi was missed by Alva and Deep, one alone and the other with Science. Science's two absentees: Bithi and that one.
| Student | Missed |
|---|---|
| Alva / Deep | Hindi only, and Hindi + Science (either way round) |
| Bithi | Science, Social Science |
| Carl | Mathematics |
| Esha | English |
| Foni | English, Social Science |
Who among the following did not appear for the Mathematics examination?
Carl missed Mathematics.
Which students did not appear for the English examination?
Esha and Foni missed English.
What BEST can be concluded about the students who did not appear for the Hindi examination?
Alva and Deep missed Hindi.
What BEST can be concluded about the students who missed the Science examination?
Bithi and one of Alva and Deep.
How many out of these six students missed exactly one examination?
One of Alva/Deep, Carl, Esha: .
For how many students can we be definite about which examinations they missed?
Bithi, Carl, Esha, Foni: .
A chain of departmental stores has outlets in Delhi, Mumbai, Bengaluru and Kolkata. The sales are categorized by its three departments - ‘Apparel’, ‘Electronics’, and ‘Home Décor’. An Accountant has been asked to prepare a summary of the 2018 and 2019 sales amounts for an internal report. He has collated partial information and prepared the following table.

The following additional information is known.
1. The sales amounts in the Apparel departments were the same for Delhi and Kolkata in 2018.
2. The sales amounts in the Apparel departments were the same for Mumbai and Bengaluru in 2018. This sales amount matched the sales amount in the Apparel department for Delhi in 2019.
3. The sales amounts in the Home Décor departments were the same for Mumbai and Kolkata in 2018.
4. The sum of the sales amounts of four Electronics departments increased by the same amount as the sum of the sales amounts of four Apparel departments from 2018 to 2019.
5. The total sales amounts of the four Home Décor departments increased by Rs 70 Crores from 2018 to 2019.
6. The sales amounts in the Home Décor departments of Delhi and Bengaluru each increased by Rs 20 Crores from 2018 to 2019.
7. The sales amounts in the Apparel departments of Delhi and Bengaluru each increased by the same amount in 2019 from 2018. The sales amounts in the Apparel departments of Mumbai and Kolkata also each increased by the same amount in 2019 from 2018.
8. The sales amounts in the Apparel departments of Delhi, Kolkata and Bengaluru in 2019 followed an Arithmetic Progression.
Electronics rose from 330 to 370 (+40), so Apparel also rose by 40 in total.
Apparel 2018: Delhi Kolkata , Mumbai Bengaluru Delhi 2019. Delhi and Bengaluru rise by , Mumbai and Kolkata by , with .
; Kolkata 2019: . AP (Delhi, Kolkata, Bengaluru 2019): .
Solving: , , , .
Home Décor: 2019 total 306, so 2018 total 236. Delhi 80, Bengaluru 60, and Mumbai Kolkata .
| Dept | Delhi | Mumbai | Bengaluru | Kolkata |
|---|---|---|---|---|
| Apparel | 42 → 50 | 50 → 62 | 50 → 58 | 42 → 54 |
| Electronics | 78 → 98 | 82 → 102 | 90 → 70 | 80 → 100 |
| Home Décor | 80 → 100 | 48 → 72 | 60 → 80 | 48 → 54 |
In Home Décor departments of which cities were the sales amounts the highest in 2018 and 2019, respectively?
Home Décor highest: Delhi in 2018 (80) and Delhi in 2019 (100).
What was the increase in sales amount, in Crore Rupees, in the Apparel department of Mumbai from 2018 to 2019?
.
Among all the 12 departments (i.e., the 3 departments in each of the 4 cities), what was the maximum percentage increase in sales amount from 2018 to 2019?
Mumbai Home Décor: , i.e. , the largest rise.
What was the total sales amount, in Crore Rupees, in 2019 for the chain of departmental stores?
Apparel 224 Electronics 370 Home Décor 306 .
In an election several candidates contested for a constituency. In any constituency, the winning candidate was the one who polled the highest number of votes, the first runner up was the one who polled the second highest number of votes, the second runner up was the one who polled the third highest number of votes, and so on. There were no ties (in terms of number of votes polled by the candidates) in any of the constituencies in this election. In an electoral system, a security deposit is the sum of money that a candidate is required to pay to the election commission before he or she is permitted to contest. Only the defeated candidates (i.e., one who is not the winning candidate) who fail to secure more than one sixth of the valid votes polled in the constituency, lose their security deposits.
The following table provides some incomplete information about votes polled in four constituencies: A, B, C and D, in this election .
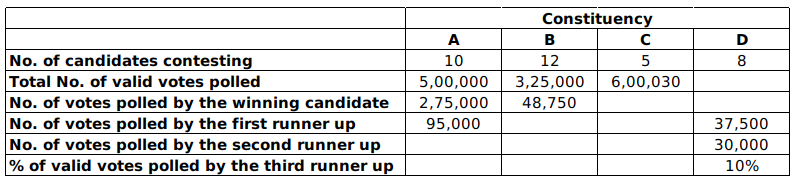
The following additional facts are known:
1. The first runner up polled 10,000 more votes than the second runner up in constituency A.
2. None of the candidates who contested in constituency C lost their security deposit. The difference in votes polled by any pair of candidates in this constituency was at least 10,000.
3. The winning candidate in constituency D polled 5% of valid votes more than that of the first runner up. All the candidates who lost their security deposits while contesting for this constituency, put together, polled 35% of the valid votes.
A candidate loses the deposit with at most of the valid votes.
A: of 5,00,000 . Second runner-up has (keeps it). The other 7 share , all losing.
B: the winner has only 48,750, below of 3,25,000 (), so all 11 losers lose deposits (2,76,250 votes).
C: each loser has more than 1,00,005, so at least 1,00,006, and gaps are at least 10,000. Minimum for the four losers: , leaving the winner at most 1,40,006; but the winner must exceed the top loser by 10,000, so at least 1,40,006. Winner , runner-up 1,30,006.
D: with : winner ; top three ; the rest , and each is below while the second runner-up (30,000) is above. It fits.
What is the percentage of votes polled in total by all the candidates who lost their security deposits while contesting for constituency A?
.
How many candidates who contested in constituency B lost their security deposit?
All losers.
What BEST can be concluded about the number of votes polled by the winning candidate in constituency C?
.
What was the number of valid votes polled in constituency D?
.
The winning margin of a constituency is defined as the difference of votes polled by the winner and that of the first runner up. Which of the following CANNOT be the list of constituencies, in increasing order of winning margin?
Margins: A 1,80,000; C 10,000; D 8,750; B anywhere from 1 up to about 23,600. D is always below C, so B, C, D, A is impossible.
For all the four constituencies taken together, what was the approximate number of votes polled by all the candidates who lost their security deposit expressed as a percentage of the total valid votes from these four constituencies?
Lost deposits: . Total valid: 16,00,030. .
XYZ organization got into the business of delivering groceries to home at the beginning of the last month. They have a two-day delivery promise. However, their deliveries are unreliable. An order booked on a particular day may be delivered the next day or the day after. If the order is not delivered at the end of two days, then the order is declared as lost at the end of the second day. XYZ then does not deliver the order, but informs the customer, marks the order as lost, returns the payment and pays a penalty for non-delivery. The following table provides details about the operations of XYZ for a week of the last month. The first column gives the date, the second gives the cumulative number of orders that were booked up to and including that day. The third column represents the number of orders delivered on that day. The last column gives the cumulative number of orders that were lost up to and including that day. It is known that the numbers of orders that were booked on the 11th, 12th, and 13th of the last month that took two days to deliver were 4, 6, and 8 respectively
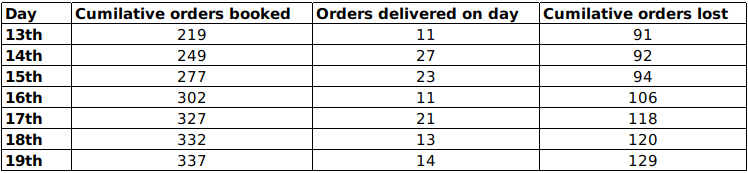
For orders booked on day : delivered next day, the day after, lost (counted on day ). Deliveries on day .
Bookings (differences of the cumulative column): 14th 30, 15th 28, 16th 25, 17th 25. Losses on a day are orders booked two days earlier: , , , , , .
Given , , :
| Booked on | Booked | Next day | Day after | Lost |
|---|---|---|---|---|
| 12th | 14 | 7 | 6 | 1 |
| 13th | 31 | 21 | 8 | 2 |
| 14th | 30 | 15 | 3 | 12 |
| 15th | 28 | 8 | 8 | 12 |
| 16th | 25 | 13 | 10 | 2 |
| 17th | 25 | 3 | 13 | 9 |
(e.g. 13th deliveries: ; 14th: ; 15th: ; then booked lost, and so on.)
Among the following days, the largest fraction of orders booked on which day was lost?
Lost fraction: 13th , 14th , 15th , 16th . Highest: 15th.
On which of the following days was the number of orders booked the highest?
12th 14, 13th 31, 14th 30, 15th 28. Highest: 13th.
The delivery ratio for a given day is defined as the ratio of the number of orders booked on that day which are delivered on the next day to the number of orders booked on that day which are delivered on the second day after booking. On which of the following days, was the delivery ratio the highest?
: 13th 2.6, 14th 5, 15th 1, 16th 1.3. Highest: 14th.
The average time taken to deliver orders booked on a particular day is computed as follows. Let the number of orders delivered the next day be x and the number of orders delivered the day after be y. Then the average time to deliver order is . On which of the following days was the average time taken to deliver orders booked the least?
: 13th , 14th , 15th 1.5, 16th . Least: 14th.
Preparing for CAT seriously? Structured courses, live classes and mocks by Dr. Kiran Derle at Target Campus.
Explore courses ↗